

My Favorite Trading View Indicators
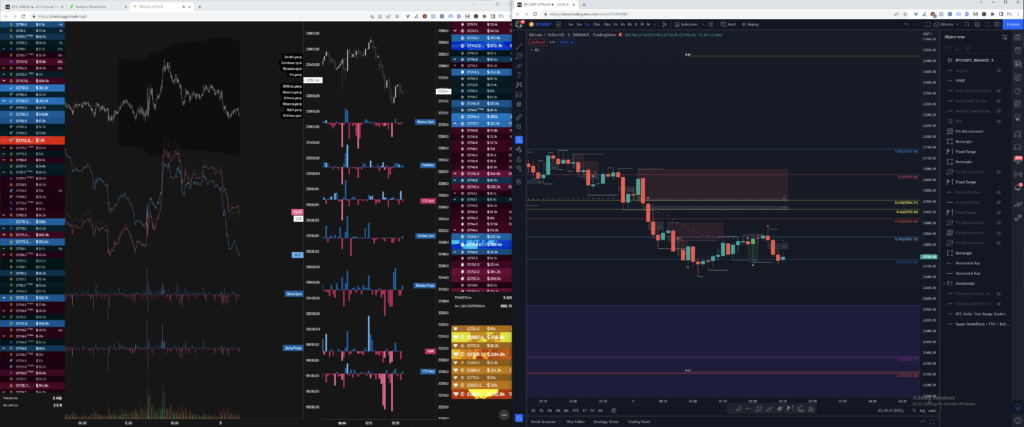
This is my typical TradingView setup.
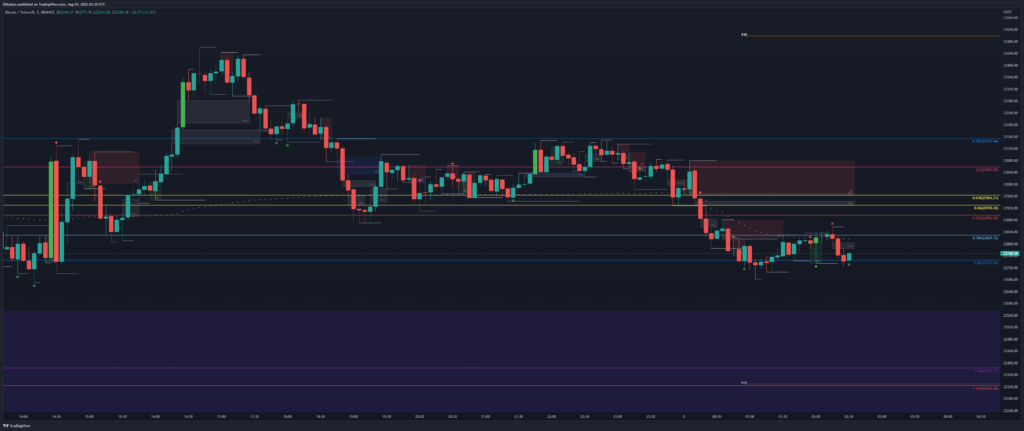
I run two charts. One window is typically Bitcoin on the 5-15 minute timeframe.
The other window is either a “Clean” Bitcoin chart, the ES chart, or Aggr Trade.
I’ll also sometimes trade forex pairs in my secondary window (most often Eur/USD or Gold).
Trading View Indicators
I’ve used quite a few indicators over the years. I’m currently using these:
- VWAP – The “Volume Weighted Average Price” indicator is a very standard indicator to show average price of all trades for the current day. The VWAP can show momentum, as well as act as a great place to take profits or scalp from.
- Pivots – I often turn the Pivots indicator on early in a session and see where the Traditional Fib Pivots and Woodie Pivots are for that day. It can be worth keeping track of the yearly, monthly, and weekly pivots as well. These have a very high track record for being tagged eventually, most often in the first three days after printing.
- Super OrderBlock / FVG / BoS Tools by Makuchaku & eFe – This is a nice little indicator to automatically mark out Fair Value Gaps, Order Blocks and Breaks of Structure. I was manually drawing these in for quite a while before finding this indicator that does the job quite well.
- BTC Daily: True Range Traders – This is a paid indicator that algorithmically calculates the days support and resistance levels during the first hour of trading after daily open. I’ve found them to have a very decent hit rate. When price is pushing up against resistance or falling to support, they act as a great reminder to not get too bullish before a pullback or bearish before a reversal.
- Sessions and ICT Killzones – This shows what session you’re in to easily look at previous session levels. I’ve noticed that each session respects it’s own previous day’s session quite heavily. It also features the ICT killzones that are times you’re likely to see pivots and price movement.
Indicators I use Sparingly
There are quite a few indicators that I use for quick checks or to see a different angle on the chart.
- Multi-VWAP by Igor – This is similar to the regular VWAP tool, but it also marks out naked VWAP levels that weren’t tagged since the new timeframe began. It can be a great way to see future support/resistance levels when price returns to a previously traded range.
- KCBs – Keltner Channel Bands – I’ve seen these used by an expert scalper (Jim Talbot). The key is to open trades when you’re hitting the bands and then close when you return to the midpoint line.
- SMA – I will sometimes check the Simple Moving Averages to see a macro perspective on price. The basic golden cross / death cross can be a profitable low effort strategy for spot investing.
- Leledc Levels – These are simple exhaustion bars that can show support and resistance.
- Ultimate ADR Price Alerts – This indicator calculates the average daily range and shows levels to take profits for either bullish or bearish price action.